 0
0
Kimberley Snow History
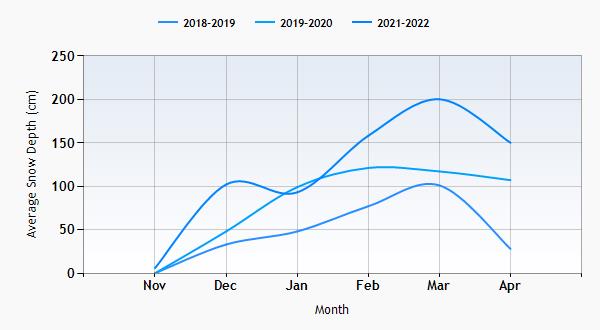
| Top/Base | 2018/19 | 2019/20 | 2021/22 |
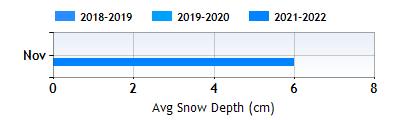
| Nov | 0-0cm | 0-0cm | 6-6cm |
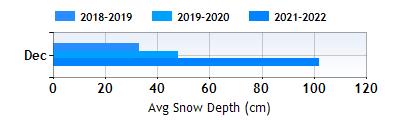
| Dec | 29-36cm | 48-48cm | 97-106cm |
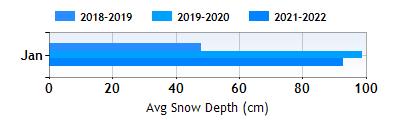
| Jan | 59-37cm | 87-111cm | 93-93cm |
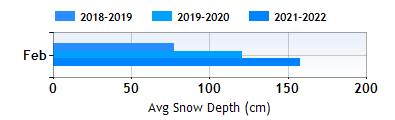
| Feb | 77-77cm | 100-142cm | 159-158cm |
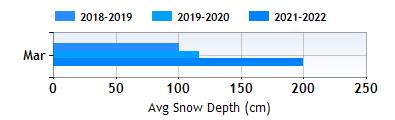
| Mar | 101-101cm | 90-144cm | 199-200cm |
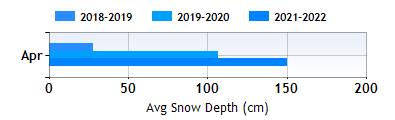
| Apr | 27-28cm | 106-109cm | 149-151cm |
Kimberley historical snow
Understand Kimberley weather & skiing conditions with the monthly Kimberley snow depth history below.
November in Kimberley
Historic weather in November has produced average snow depth of 2cm at the top and 2cm at the bottom of the ski area.
December in Kimberley
Historic weather in December has produced average snow depth of 64cm at the top and 58cm at the bottom of the ski area.
January in Kimberley
Historic weather in January has produced average snow depth of 80cm at the top and 80cm at the bottom of the ski area.
February in Kimberley
Historic weather in February has produced average snow depth of 125cm at the top and 112cm at the bottom of the ski area.
March in Kimberley
Historic weather in March has produced average snow depth of 148cm at the top and 130cm at the bottom of the ski area.
April in Kimberley
Historic weather in April has produced average snow depth of 96cm at the top and 94cm at the bottom of the ski area.


© 2026 SNO Group Ltd • company no. 5995288 • VAT no. 946 9394 63 SNO, Apsley House, 176 Upper Richmond Road, London, SW15 2SH.
| why log in? |
Save Wish List view on any device
Share Holidays choose with friends
020 7770 6888
